Manipulate
Types of data show up in Beyond 20/20 tables as dimensions. Dimensions can appear either as rows or columns, and include things like gender, age, location and time.
The different colours of the dimension headings tell you what they are doing in the table.
- Yellow dimension headings are in the row position.
- Blue headings are in the column position.
- Grey headings at the top are not currently in the table.
- Black highlights whichever dimension is currently selected, or the active dimension.
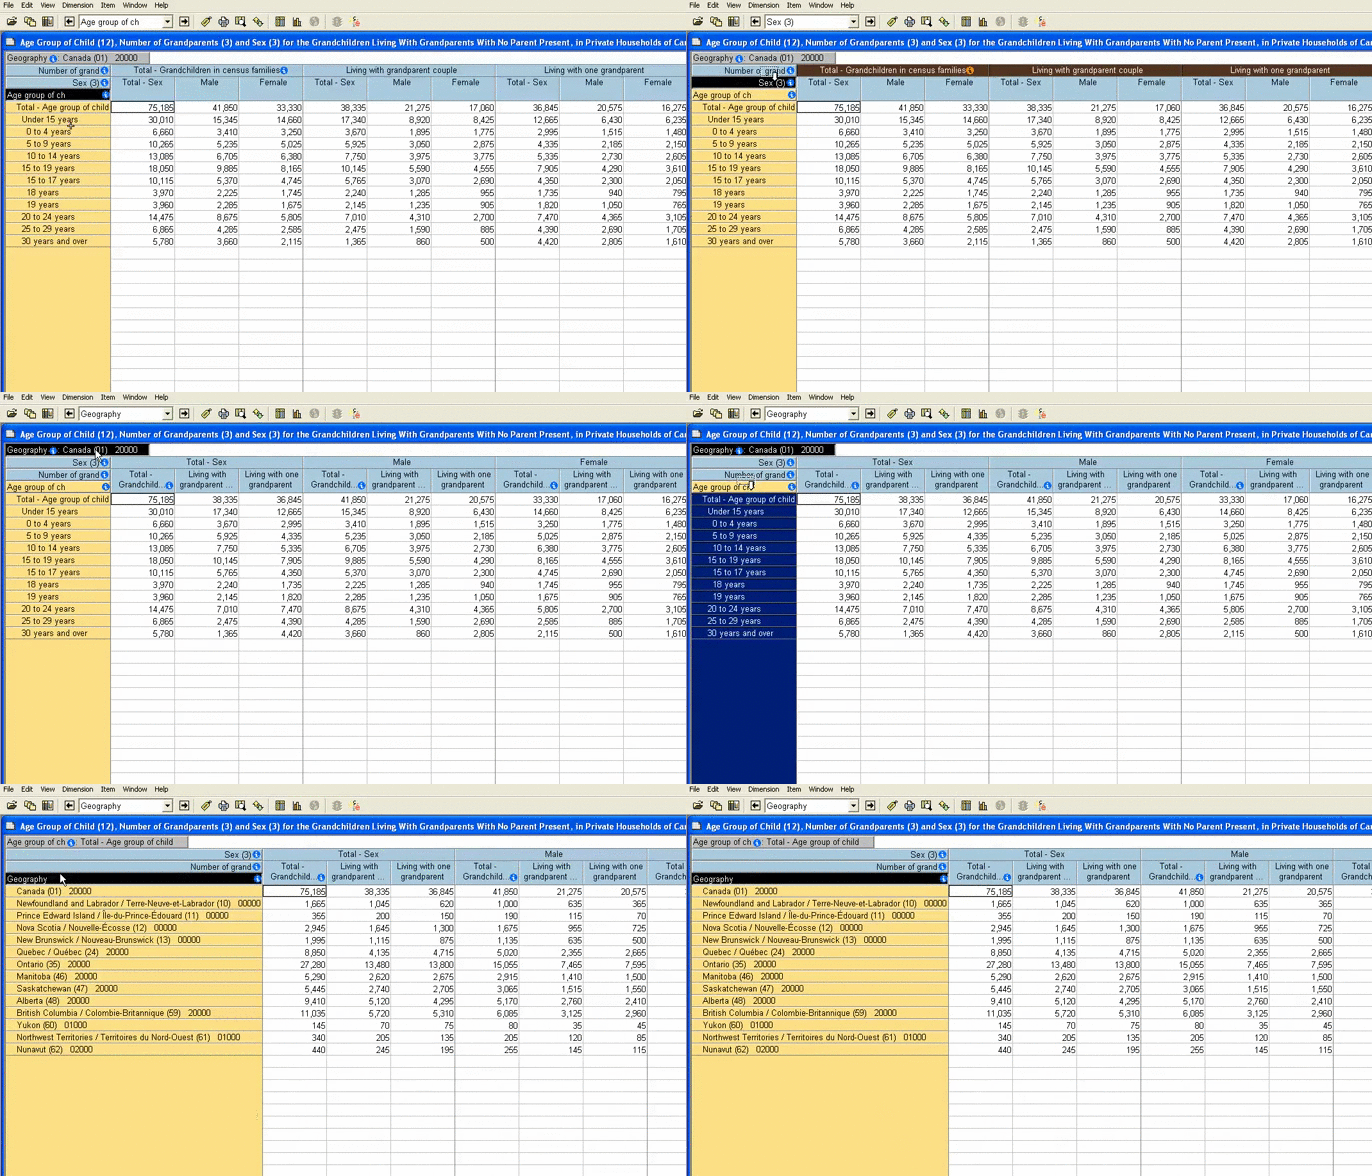
- You can drag dimensions around to put them where you want.
Beyond 20/20 lets you stack several dimensions in columns, but only allows one dimension for rows.
B20/20 tables open with only two dimensions showing, even if more dimensions are available. The available dimensions appear grey in the top bar.
Add a dimension
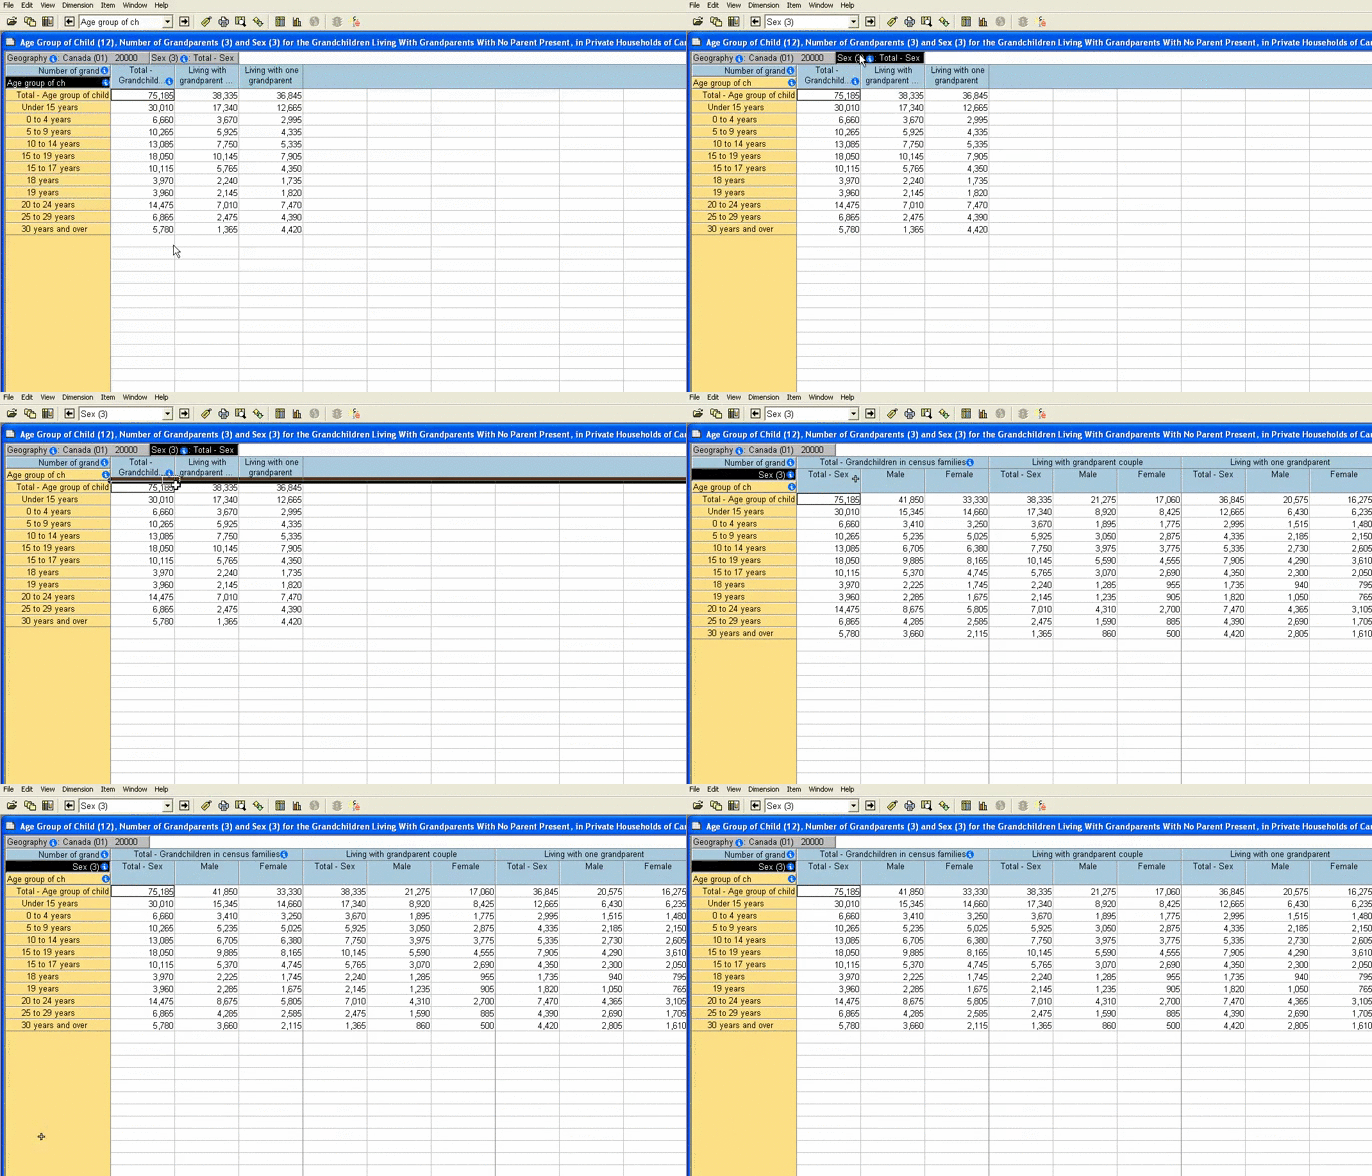
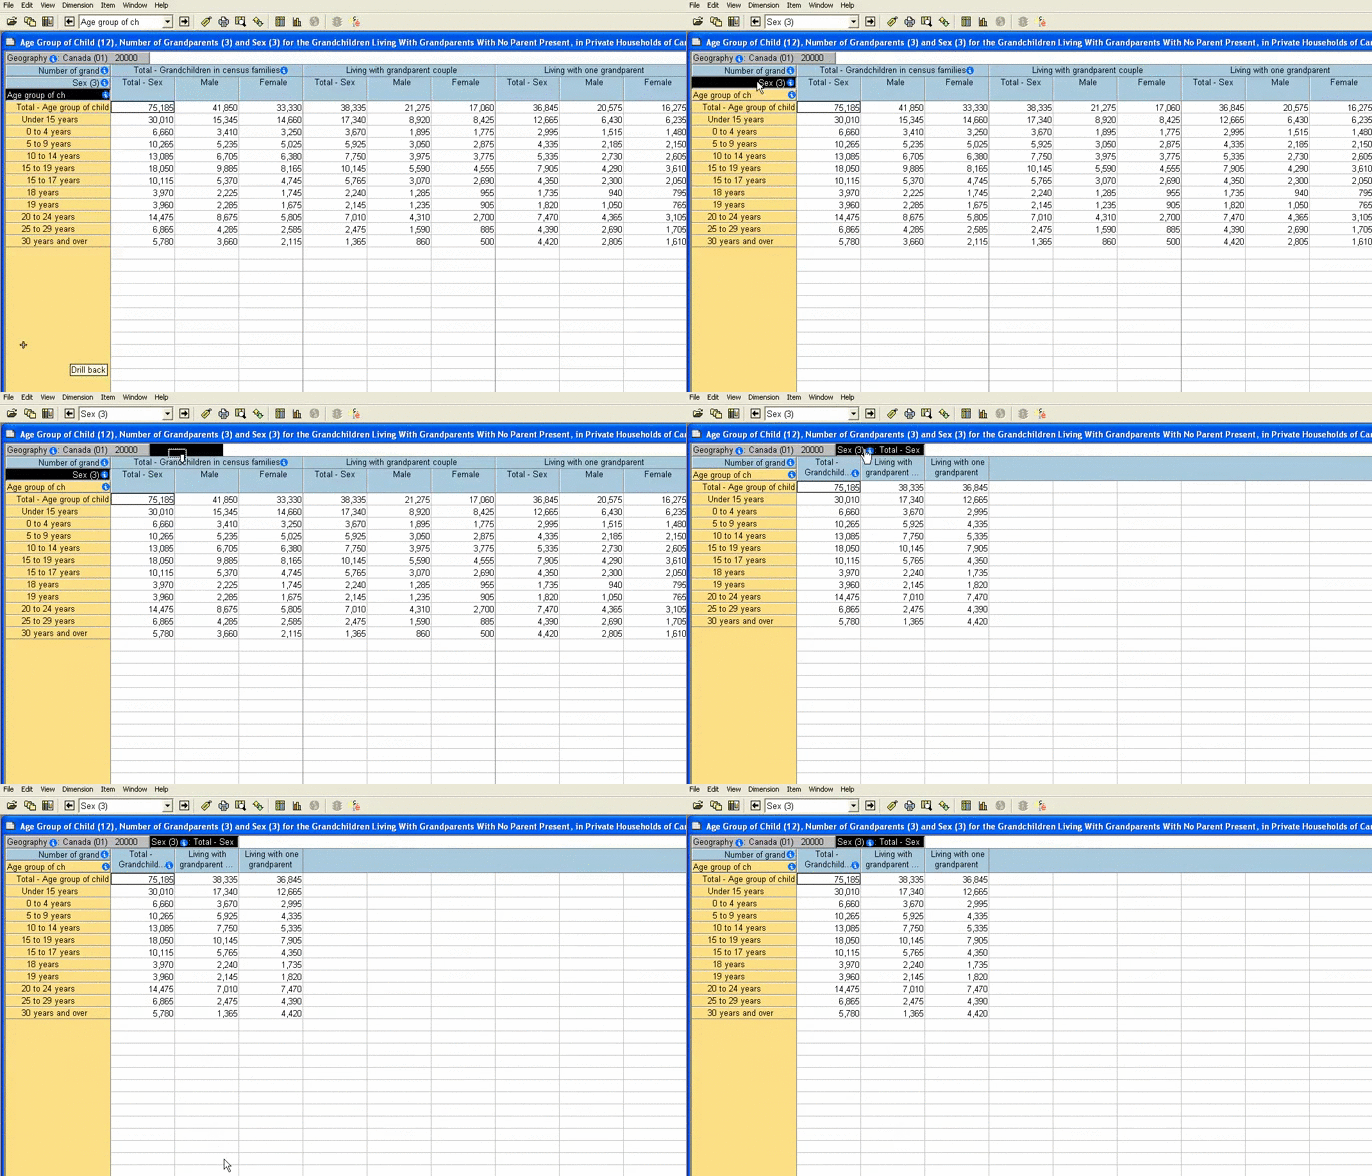
Drag the dimension you wish to add onto the table. Make sure you see the bold highlight bar and then drop it on the table.
Remove a dimension
Drag unwanted dimensions from the table up into the white bar above.
Switch the places of dimensions
If you drag one dimension onto another, they will switch positions. This works for switching between columns and rows, and also for switching in and out of the table.


